
When the Jobsite Starts to “Speak”: Hong Kong Government LiDAR Validation Report — How 4D Point Clouds and AI Transform Construction Management
Fixed LiDAR + cameras + edge computing + AI + large models, building a 4D digital record of the site
1. From 3D to 4D: what is a 4D point cloud?
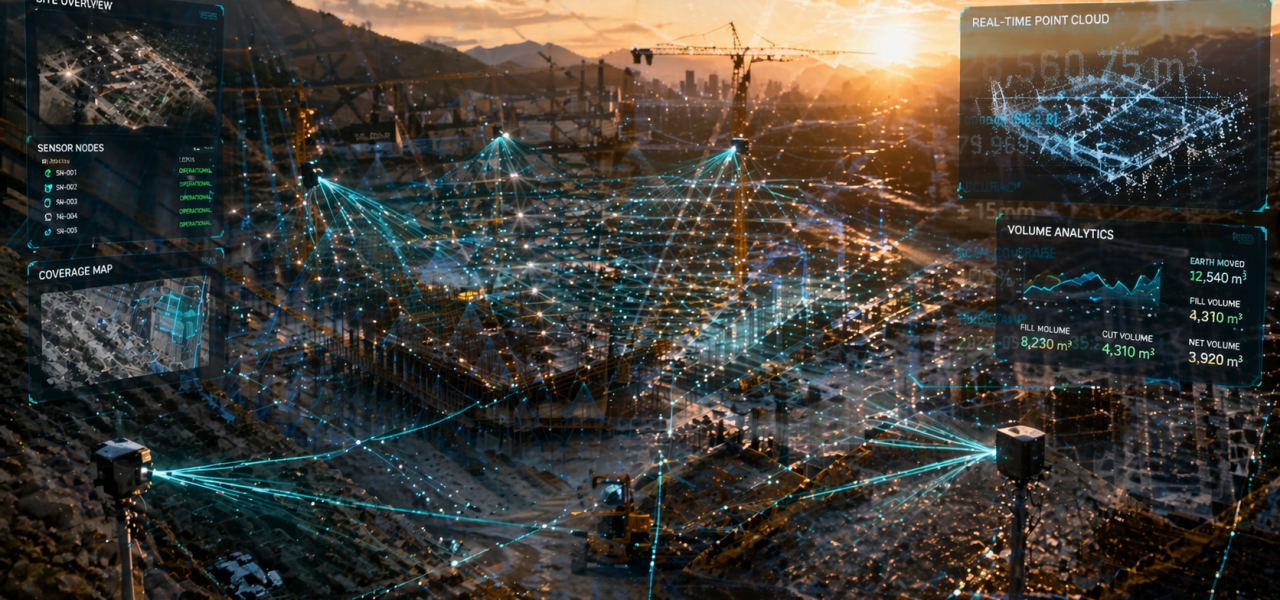
A point cloud is a set of spatial points with 3D coordinates (X, Y, Z); each point may also carry color, reflectance intensity, and other attributes. Think of it as photographing a construction site with millions of points that each have coordinates.
- 3D point cloud: a static geometric snapshot of the site at one moment;
- 4D point cloud: adds a time dimension by repeatedly scanning the same location (e.g., daily) to form a point-cloud time series—showing not only the shape of an excavation, but how that shape changes over time: where digging or backfilling is happening, and whether slopes are displacing.
In the Hong Kong project, fixed LiDAR nodes automatically capture point clouds at a set frequency (e.g., hourly or daily). Stored with timestamps, these data form a 4D digital record of the site.
2. LiDAR + cameras: complementary precision and semantics
Cameras alone provide rich texture and color but cannot directly measure distance or produce 3D coordinates; LiDAR alone yields precise 3D point clouds but lacks color and visual semantics. The report therefore uses sensor fusion: LiDAR and HD cameras are co-mounted on each node, calibrated, and RGB pixels are mapped onto the point cloud to produce a true-color cloud.
- Visualization-friendly: the cloud is no longer a gray fog—it becomes a near-real-world color model that non-specialists can understand;
- Foundation for AI detection: color clouds combine geometric and color features to improve detection of objects such as safety vests, people, and machinery.
3. Edge computing: why not send everything to the cloud?
On a 5-hectare site, each LiDAR node can produce hundreds of thousands of points per second, plus HD video—enormous data volume. Shipping everything to the cloud consumes bandwidth and adds latency, so each node hosts an edge processor that:
- Compresses data: compresses raw point clouds and images to reduce transfer volume;
- Builds preliminary models: generates a preliminary color point-cloud model locally instead of sending raw laser returns;
- Runs real-time detection: simple safety rules such as geofence intrusion can be judged at the edge and trigger local alarms.
Edge-processed data is then uploaded via 5G routers. The report notes that after backend optimization and Wi-Fi tuning, system response time improved by about 35%.
4. AI detection models: “hazard-zone intrusion” and “safety vest” recognition
1. Hazard-zone intrusion detection (dynamic geofencing)
- Geofence definition: each hazard zone gets a set of 3D boundaries—regular cubes or irregular polyhedra;
- Real-time localization: people or equipment detected as targets in the point cloud have their 3D coordinates computed continuously;
- Intrusion logic: target coordinates are tested for spatial containment within the fence; entry triggers an immediate alarm. Dynamic fences can be adjusted by construction phase without physically moving sensors.
2. Safety vest detection
- Data sources: mainly camera video streams, combined with point-cloud reflectance cues (safety vests are often highly reflective);
- AI models: object-detection networks (the report cites deep models such as IA-SSD) locate people and classify whether a safety vest is worn;
- Outputs: when a non-compliant person is detected, the system records the violation (time, location, screenshot) and pushes it via dashboard or instant message.
With overall UAT pass rates around 90% and continuous optimization during the care period, these features reached usable reliability in real site conditions.
5. Point cloud–to–BIM comparison: the core algorithm for progress tracking
Inputs are the day’s true-color point cloud (georeferenced) and the project BIM model (IFC or Revit, also georeferenced). Processing flow:
- Registration: rigidly align (translate + rotate) the point cloud to the BIM model, refining accuracy with georeference anchors;
- Segmentation: extract target regions from the cloud, such as soil to be excavated or poured concrete structures;
- Difference calculation: for earthworks, compute volume difference between the ground surface and the design surface to get excavated and remaining volumes; for structures, compute normal distances between the actual cloud and BIM to produce deviation heat maps;
- Outputs: visual difference maps plus quantified data (volume difference, area difference, max-deviation locations, etc.).
The report notes that during the care period, ground-level calculation algorithms updated from user feedback “significantly improved” excavation tracking accuracy—showing continuous optimization via closed-loop feedback with field measurements.
6. The role of large language models (LLMs) in site management
LLMs are not used to control LiDAR or perform geometric computation; they support natural-language interaction and report generation. The AWS-based architecture has three flows:
- Automatic report generation: on a schedule, pull key data (safety violations, progress deviations, IoT readings, etc.) from the database, call an LLM via API to generate narrative text and summaries from templates, and output PDF/HTML reports;
- On-demand report download: when a user clicks “Generate latest report” on the web dashboard, the system immediately pulls the newest data, calls the LLM, and returns the report;
- Real-time chat: users ask in natural language (e.g., “How many hazard-zone intrusions occurred last week?”); the LLM turns this into a database query and returns a natural-language answer.
7. End-to-end data flow: from sensors to dashboard
LLMs are not used to control LiDAR or perform geometric computation; they support natural-language interaction and report generation. The AWS-based architecture has three flows:
- Acquisition layer: fixed LiDAR + cameras + IoT sensors (air quality, temperature/humidity, vibration, tilt) collect raw data in real time.
- Edge layer: each node compresses data, builds preliminary models, caches locally (node storage), and uploads via 5G routers.
- Cloud layer: post-processing (registration, filtering, classification), relational storage, AI models (safety detection, progress comparison), and LLM services (reports, chat).
- Application layer: a web dashboard shows live point clouds, video streams, alerts, and progress charts; users download reports or use chat from the dashboard.
The report especially stresses the need for edge–cloud collaboration: the edge owns real-time response and bandwidth optimization; the cloud owns complex computation and durable storage.
8. Technology maturity and takeaways
The Hong Kong EMSD report concludes clearly: “Functionally complete, technically stable, and ready for users.” UAT pass rate was about 90%, and response time under load improved by about 35%.
The report also notes early issues—unstable networking, unfriendly UI, inaccurate volume algorithms—resolved through a soft-launch → feedback → care-period improvement loop. That means fixed LiDAR + AI + 4D point-cloud site monitoring has reached engineering usability; adopters should reserve 1–3 months for trial operation and optimization.
Closing remarks
This report shows a complete technology stack: from LiDAR–camera hardware fusion, through edge computing and 5G transmission, to AI detection and LLM analysis, landing as a web dashboard site managers can use every day. Technology is no longer an isolated “sensor” or “algorithm,” but a deployable, verifiable, iterable system. Twelve months of operating data from the Yuen Long site provide a valuable technical baseline for the industry.